
|
BRHS /
Interaction Of Blast Wave With Structure And Structural ResponseThe effects from an explosion, which have an impact on structures, are pressure changes (blast wave) and air movement (“explosion wind”) as well as thermal radiation and flying missiles. Only a third of the chemical explosion energy is involved in the generation of the detonation blast wave; the other two thirds are released much slower during the subsequent mixing and burning of the detonation products with the air [FEMA 2003]. In general, structural responses are highly dynamic, highly inelastic, and highly interactive. The mechanical effect of a blast wave is determined by the overpressure. Pressure-time characteristics of an unconfined gas cloud deflagration are different from an explosive, because it exhibits a finite rise time to the maximum overpressure, where the flame front velocity as a decisive parameter leads to a decoupling of pressure wave and impact time period. In contrast, a TNT explosion is relatively short. The duration of the positive phase of a shock wave is an important parameter in the structural response to a blast. The pressure load exerted upon a structure has to act for a certain period before damage can occur. Pressure waves result from relatively slow explosions, e.g., a deflagration of unconfined vapor clouds. In contrast, shock waves develop after very short explosion processes like detonations. The blast parameters are dependent on the distance between structure and blast center. At close distances, the target is exposed to a high-intensity pressure load over a localized region; at greater distances, the load is reduced, but covers a larger surface area. The diagram in Fig. 3-7 describes the pressure load on a rectangular structure. 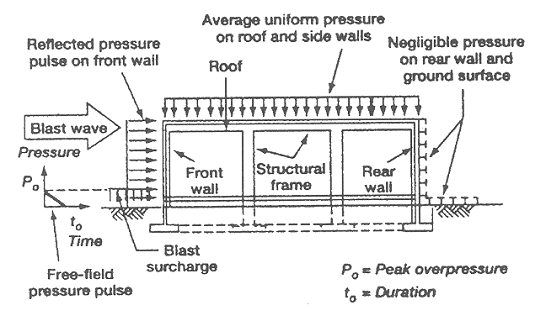 Fig. 3-7: Simplified blast loading diagram on a rectangular building [Benteftifa 1995] The dynamic interaction of a blast wave with the structure depends on the pressure-time history, i.e., rise time and duration of positive phase and peak pressure or the impulse (which is the time integral of the pressure). It is distinguished between the initial “diffraction loading” and the subsequent “drag loading”. Diffraction loading is given by forces resulting from direct and reflected pressures during the initial phase. Reflection of the pressure wave at the front side amplifies the incident peak pressure. Also density and temperature of the reflected wave are increased compared to the incident wave. The flow around the obstacle determines the further pressure development at the front and at the back side. The net horizontal loading is that on the front minus that on the back face. The reflection coefficient, i.e., the ratio between reflected and incident overpressure, is dependent on the blast wave type (pressure or shock wave), its intensity, and on the incident angle. For a pressure wave, this coefficient can have a value up to about 3 depending on the incident angle (the more usual case will have an oblique incidence). For a shock wave, it can be in the range of 2-8 and even higher for explosives (see Fig. 3-8). Dynamic loads of fast transient pressures are imposed, if the combustion energy is inhomogeneously distributed, and are specific to the structure geometry. 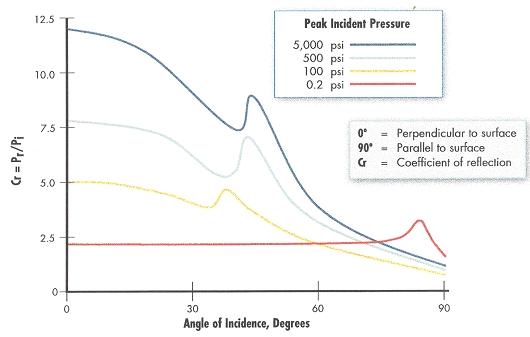 Fig. 3-8: Reflected pressure coefficient as a function of the incidence angle, from [FEMA 2003] After the diffraction phase is completed, the structure is subjected to a “stagnation pressure”. The distance of the incident wave when interacting with the structure, causes major pressure differences developing from the edges of the structure. Resulting from this rarefaction wave, pressures decrease. During this so-called drag phase, strong transient winds (explosion wind) with flow velocities of several 100 m/s are effective. Drag forces will particularly have an impact on smaller structures such as pipe work. Load duration during vapor cloud explosions may be long enough to be comparable with the time required for the dynamic response time of the structure. In case of large structures, the rarefaction from the edges is insignificant. In a confined or partially obstructed area, an explosion will create a mixture of reflected pressure waves and deflected air flows, which are the result of reverberation of the initial high-pressure, short-duration reflected wave with the amplitude decaying with each reflection. This mixture of waves imposes a more or less complex load upon a building. The more complex the structure, the more difficult is the prediction of the critical conditions for mechanical failure for a given load history. Forces acting on a structure will lead to a deformation to an extend which depends on the material properties and structure composition. For a static or quasi-static load, i.e., a constant or slowly changing load like from a simple deflagration, it will be in equilibrium with the internal forces resulting in a deformation of the structure. For a dynamic load, i.e., a fast load transient, however, a “dynamic” contribution from inertia forces will add to the equilibrium, which can show positive or negative acceleration, i.e., mass and stiffness of the structure will play a major role. The load from a gas explosion is considered a dynamic load due to its short overpressure duration, which is typically in the range of 100 - 200 ms. A structure can be schematically represented by a system of masses coupled with springs or dampers. If linear-elastic or non-linear-elastic forces are acting, displacements of the masses become zero again, when the load disappears. In case of plastic or elasto-plastic behavior, displacement is zero or very small, until the maximum load is reached. Under a static load, the structure will then fail; under dynamic load, it may retain a residual displacement. In general, structures must be designed to react elastically under typical loads like wind. Plastic displacement must be limited to abnormal load conditions. The maximum displacement depends on load duration, tD, and the natural frequency of the structure, T. For low tD/T ratios, the displacement is smaller than for static loads. For large tD/T ratios, the displacement can be larger than under static load conditions. Other important parameters are the static strength and the ductility. Load schemes are distinguished between a step function for a long-duration pressure wave and an impulse load for a short-impact shock wave. Detonations tend to excite the high natural frequencies of a building, whereas deflagrations are more effective for the lower frequencies. It appears to be technically more difficult to design a building against both explosion modes rather than only one. The analytical procedure is usually simplified by introducing a so-called dynamic load factor (DLF), which is defined as the ratio of maximum dynamic displacement over static displacement. It transforms a dynamic peak load into a static load with the same effect on the structure. The DLF is dependent on the dynamic load time and the natural frequencies of the structure. For long explosion times and in case of an idealized triangle-shaped shock wave load, the DLF approaches its boundary limit of 2. A comparison between detonations of explosives and blast waves resulting from nuclear weapon explosions, characterized by quasi-static pressure due to a longer impulse time shows that, assuming the same damage, the detonation pressure or the pressure resistance of an object is much higher than the resistance against a blast wave from the nuclear tests [Pfoertner 1975]. The pressure resistance behavior of a building under detonative dynamic and quasi-static loading derived from numerous detonative explosion studies can be summarized in an empirical equation for the quasi-static reference overpressure of the building pst: pst = 0.15 pr2/3, where pr is the perpendicularly reflected overpressure or the pressure resistance of the building subjected to a detonation. If the TNT equivalent, as derived from the damage of some of the severe accidents, is interpreted as the incident pressure wave in the order of 70 kPa, resulting from a deflagration, the respective quasi-static pressure would be with pst = 22 kPa much smaller. In a simple method, a static working load is assumed to simulate the effects of blast loads onto structures. This conservative approach, however, cannot predict structure performance and seems to be not optimal for transient blast loads. An improvement of modeling is given with the quasi-static methods which specify a triangular pressure pulse and determine the dynamic structural capacity as a function of the material strengths of the structure. The structural response can be found by using the charts. Single degree-of-freedom (SDOF) models analyze critical components in terms of their structural resistance and predict the response of the structure, which then determines the damage level. But also these methods are still likely to lead to very conservative structural designs, and rather suitable for hand calculations. More information is obtained from multi-degree-of-freedom (MDOF) models, sophisticated CFD models with the possibility to consider flame propagation and pressure profiles also from local explosions. Dynamic finite-element analyses with tools such as ADINA, DYNA-3D may provide the best judgement on whether or not a structure is able to withstand a blast wave. An empirical and very global approach of determining the strength of structures is to relate overpressures to the degree of observed damage. The relationship between pressure and damage, which is derived from TNT explosions, cannot satisfactorily be transferred to vapor cloud explosions. The pressure decay from a TNT explosion is much faster than from a vapor cloud explosion. The high impulse and the suction effect due to the below-atmospheric pressure phase will certainly result in a different damage pattern. Thus damage criteria such as those derived by Schardin (see Fig. 3-9) from TNT explosions are not directly applicable [Giesbrecht 1988]. 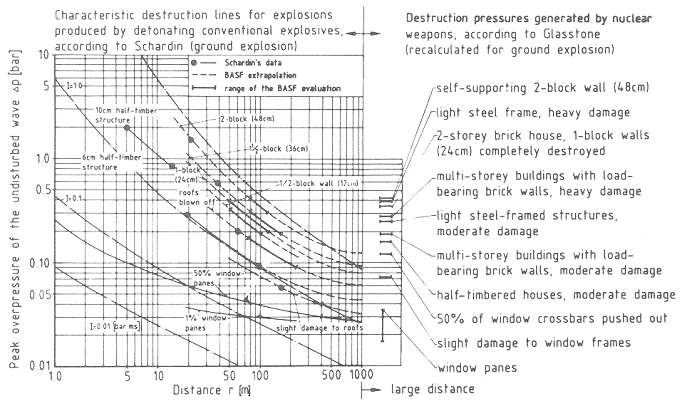 Fig. 3-9: Schardin destruction curves for detonation waves, from [Giesbrecht 1988] Many pressure criteria were defined in the past related to various structures and specific components, however, varying over a large uncertainty range. A rough classification is given in Table 3-1. Table 3-1: Damage classification, from [TNO 1992]
The impulse, i.e., the pressure – negative and positive – integrated over time, is a measure for the explosion energy (Fig. 3-10), which also varies in time and space over the exposed structure surface. Damage to the structure resulting from a blast wave may be subdivided into direct effects and what is named “progressive collapse”, a kind of secondary failure following the change of the load pattern on a structure due to the direct effects. Features of a P-I diagram are the asymptotes in P and I direction and the monotonic relation between P and I, which suggests a subdivision into three regimes: impulse-controlled, peak load-controlled, and an intermediate dynamic stage [Li 2002]. P-I diagrams are being widely used in damage assessments not only for structural damage, but also for predicting blast-induced human injuries. 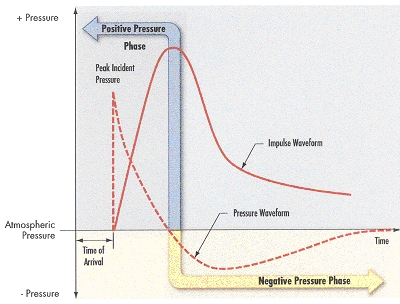 Fig. 3-10: Transient behavior of impulse, from [FEMA 2003] Damage levels can also be visualized in pressure-impulse diagrams, where different regions can be defined by iso-lines. An example is given in Fig. 3-11 showing the experimental results for the observed damage in per cent, after different types of houses were exposed to a certain explosion (pressure/impulse) load [TNO 1992]. Important for the damage effect of a short-term load (= shock wave) is only the impulse, whereas it is the maximum overpressure for that of the longer-term load (= pressure wave). The solid lines in the figure indicate the lower boundaries for light damages, for severe damages, and for collapsing structures of the houses investigated. This will be different for other types of structures. Similar PI diagrams have also been derived for impacts on humans. They are providing useful information on the vulnerability of targets. 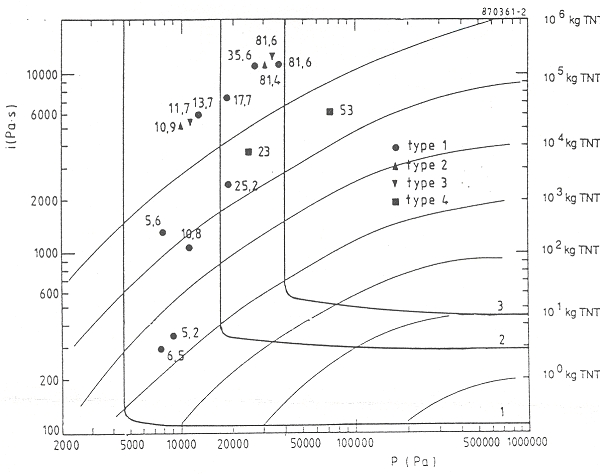 Fig. 3-11: Pressure-impulse diagram with experimental damage values for different types of houses, from [Mercx 1991] The estimation of the level of damage is usually done taking either fixed-limits methods or the PROBIT method. In a fixed-limits method, the hazard level is compared to fixed limits like IDLH (Immediately Dangerous to Life or Health) values or pressure thresholds, as given in the literature. It is a simple method, but may lead to wrong conclusions in transient hazards. In such cases, the PROBIT method is the more appropriate one. First a hazard load, L, is estimated, which could be the overpressure in an explosion or the integrated thermal flux at a certain location. Then the PROBIT or probability unit, y, is given by y = k1 + k2*ln L, which can be related to a certain probability of death, injury, or damage. k1 and k2 are empirical parameters, which are specific to, e.g., toxic chemicals or fire and explosion effects and can taken also from the literature [CSChE 2004]. SRI model For the assessment of the probability to obtain a certain level of damage, so-called probit functions have been introduced and suitable damage criteria have been defined. For industrial installations, [TNO 1992] provides the following limits to be met for the control building:
<< | Content | >> |