
|
BRHS /
DetonationDetonation basicsDetonation direct initiationDirect initiation of detonation can be achieved by condensed explosives, explosion of another gas mixture, electrical wire explosion, high-voltage sparks, and laser sparks. The conditions are characterized by the critical (minimal) energy E^*_n required to produce a shock wave going over to a self-sustained detonation; n = 1, 2, 3 denotes planar, cylindrical, and spherical waves respectively. The rapid release of a spatially concentrated source of energy results in the production of a decaying blast wave in the surrounding gas. A very strong gradient in temperature and pressure occurs behind the blast wave and serves to quench the chemical reaction. On the other hand, the very high temperatures produced behind the blast induce very rapid chemical reaction. The net effect of quenching due to strong gradient and accelerated reaction due to strong blast waves result in either initiation or failure depending on the strength of the source. A heuristic limiting condition proposed by Zel'dovich (ZeldovichYaB:1956) is that at least one reaction time must have elapsed before the instantaneous Mach number reaches the CJ value for initiation to be successful. Combining this simple criterion with strong blast wave (similarity) theory results in a quantitative prediction for the critical energy (LeeJHS:1966). In a spherical geometry, the result is: E_{c} =I\left(\gamma \right)\rho _{0} D_{CJ} \Delta ^{3},
where \Delta is the induction length and I\left(\gamma \right) is a constant of the order of 1 determined by blast wave theory. This expression can be used together with detailed kinetic computations of the reaction zone length to estimate the critical initiation energy for specific fuel-oxidizer mixtures. Atkinson (AtkinsonR:1980) showed satisfactory agreement between their kinetic computations and experimental data for hydrogen-air initiation. Zeldovich Ya.B., Kogarko S.M. and Simonov N.N. (1956) An experimental investigation of spherical detonation of gases. Soviet Physics - Technical Physics, 1:1689-1713.(BibTeX) Hugoniot curveFor steady, one-dimensional flow of a combustible gas that burns to completion, equations relating initial and final conditions are called the Rankine-Hugoniot relations and they provide jump conditions across the front, from upstream (subscript 0) to downstream (subscript \infty ) . These equations are:  Figure 1. Schematic locus of burnt-gas states for combustion waves (LinanA:1993). m_{0} \equiv \rho _{0} u_{0} =\rho _{\infty } u_{\infty } P_{0} \equiv \rho _{0} u_{0}^{2} +p_{0} =\rho _{\infty } u_{\infty }^{2} +p_{\infty } The sequence of final states obeying p_{\infty } +m_{0}^{2} /\rho _{\infty } =P_{0} \equiv p_{0} +m_{0}^{2} /\rho _{0} obtained by substituting first two equations, is the Rayleigh line, a straight line in the plane of final pressure p_{\infty } , and specific volume, 1/\rho _{\infty } , such as Fig.1. Use of energy conservation equation together with second jump condition provides a relationship among thermodynamic properties, the Hugoniot curve, which can be written as: \left(\frac{\gamma }{\gamma -1} \right)\left(\frac{p_{\infty } }{\rho _{\infty } } -\frac{p_{0} }{\rho _{0} } \right)-\frac{1}{2} \left(\frac{1}{\rho _{\infty } } +\frac{1}{\rho _{0} } \right)\left(p_{\infty } -p_{0} \right)=h_{0} where h_{0} is the total amount of chemical heat release per unit mass of the mixture, The Hugoniot curve is shown schematically in Fig. 1 for a representative combustion system. The final state is determined by the intersection of the Rayleigh line with the Hugoniot curve. The Hugoniot curve has two branches, an upper branch of large \rho _{\infty } and p_{\infty } , called the detonation branch, and a lower branch of small \rho _{\infty } and p_{\infty } , called the deflagration branch. There is a minimum propagation velocity for detonations, corresponding to tangency at the upper Chapman-Jouget point. The Rankine-Hugoniot equations can be solved by e.g., STANJAN code, examples of results from such computations for hydrogen-oxygen and hydrogen-air mixtures are given in Table 1. Table 1. Calculated detonation properties for hydrogen mixtures with oxygen and air initially at 298 K and 1 atm (ReynoldsWC:1986).
Overdriven detonationUnder certain circumstances, it is possible for the detonation wave to move faster than the unique steady-state velocity given by CJ theory. This usually occurs because another event causes the detonation products to move faster than the velocity they would have in a CJ wave. As a result, the pressure associated with the overdriven detonation front can be significantly higher. The extent of pressure increases that can occur can be seen in Table 2 for hydrogen-air and hydrogen-oxygen detonations. Table 2. Theoretical pressure (bar) for overdriven detonation in stoichiometric hydrogen mixtures (TeodorczykA:1992).
Linan A. and Williams F.A. (1993) Fundamental Aspects of Combustion. Oxford University Press.(BibTeX) Chapman-Jouget detonationOne-dimensional detonation theory was developed independently by Chapman (ChapmanDL:1899) and Jouguet (JougetE:1906) and was based on the preceding shock theory, with the inclusion of an addition energy term corresponding to the energy released by chemical reaction. In this theory, the C-J theory, the chemical reaction is assumed to occur infinitely fast. Further manipulation of equations leads to the following expression q_{CJ} =\frac{\left(M_{CJ}^{2} -1\right)^{2} a_{1}^{2} }{2\left(\gamma _{b} -1\right)M_{CJ}^{2} \left(\gamma _{b} +1\right)},
which relates the resulting wave Mach number M_{CJ}, the corresponding energy release q_{CJ}, the sound speed in the initial reactants a_{1} and the ratio of specific heats of the product gases \gamma_{b}. In a CJ detonation, the reactants at an initial pressure, temperature and density are transformed instantaneously to products at a final pressure, temperature and density. The CJ theory gives a remarkably accurate prediction of detonation velocities based only on a knowledge of the initial conditions and despite the actual complexity of a real detonation. Chapman D.L. (1899) On the Rate of Explosion in Gases. Physics of Fluids, 47:90-104.(BibTeX) Detonation limitsExperiments show that there exist definite limits beyond which a detonation cannot exist. These depend on the composition, temperature and pressure of the mixture, and also on the geometry and roughness of the vessel. Approaching the detonation limits the detonation wave first begins to pulsate, becomes “multi-headed” and then changes its character completely: the detonation front starts to move along a helical path – this mode is called spinning detonation. Table 1 shows limits of detonability in comparison with deflagration limits which are wider. Detonability limits of confined mixtures are not unique, but strongly depend on the boundary conditions of the medium in which the detonation propagates. This is shown by the results of Table 1 from the experiments performed in tubes of different diameter. Table 1. Experimental deflagration and detonation limits for hydrogen.
 Figure 1. Effects of fuel concentration and tube diameter on the onset of single-head spin detonation (KuoKK:2005) Over the range of detonable concentrations of a given fuel-oxidizer mixture, the wave structure is called multi-head wave front. This wave is characterized by relatively weak transverse waves in compari-son to the axial component, which allows it to be considered roughly one-dimensional as in the ZND model. It has been observed that, in a given smooth circular tube, as the mixture composition becomes leaner or richer, the multi-head, self-sustained detonation becomes a single-head spinning detonation propagating at about the CJ velocity. The critical tube diameter dc for detonation propagation in un-confined space outside the tube was discovered which is related to the characteristic transverse wave spacing (detonation cell size) \lambda by:
A schematic illustration of wave motion in a detonation cell is shown in Figure 1 in article Detonation front structure. In Figure 1 the tube diameter is plotted against fuel concentration around the lean limit. In the region above the curve, known as the self-sustained detonation region, multi-head detonations propagate. As early as (KogarkoSM:1948) proposed that, at the onset of single-head spin in a smooth circular tube, the detonation cell width \lambda , must be equal to the tube circumference, \lambda = \pi d^*
This limiting tube diameter is designated as d*. Later this criterion was confirmed by (LeeJHS:1985) and (DupreG:1985). Figure 2 presents critical tube diameter for hydrogen and some hydrocarbon fuels and Figure 3 shows limiting tube diameter for same fuels.  Figure 2. Correlation of critical tube diameter with the empirical law d_c = 13 \lambda (KuoKK:2005)  Figure 3. Variation of the minimum limiting tube diameter d^* = \lambda / \pi for stable propagation of detonation in tube Kuo K.K. (2005) Principles of Combustion. John Wiley \& Sons, New York.(BibTeX) Detonation front structureStandard practice of evaluation possible hazards, which can come from detonation precesses is usually based on the theory of steady state one-dimensional detonation. The predictions of such theory are well-known and usually can have sufficient accuracy to provide necessary information for industrial designs. 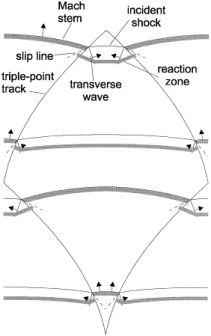 Figure 1. Schematic presentation of multi-dimensional detonation front structure (KuoKK:2005). However there are numerous examples demonstrating non-stationary and multi-dimensional nature structure of the detonations. These features can affect the maximum local pressures during detonation process and therefore can be important from the point of view of safety aspects for industrial applications. Detonation waves in the mixtures, which are far enough from detonation limits, have internal multi-dimensional structures. Already classical works on structure of detonation waves, e.g. ((VoitsekhovskiiBV:1966), (StrehlowRA:1970), (StrehlowRA:1969b), (StrehlowRA:1969c)), permitted to discover different type of detonation waves:
In case of lean or reach mixtures, which are close to their detonation limits, detonations occur usually exhibiting characteristics of the second or third types. Unfortunately, most of the experimental work was performed for the mixtures far from detonation limits, and detonations of marginal mixtures are not studied in full volume. Note that the role of front structure, as a rule, appears to be more significant in case of lean mixtures detonations, which are typical for industrial accidents. Multi-dimensional structure of the detonation front includes leading shock wave and a number of transverse waves, which propagates perpendicular to the leading shock, reflecting from each other and from bounding walls. The surface of the leading shock consists of the sequence of convex parts, which start chemical reaction, and concave parts which are fast decaying waves. Additional reaction zones are located behind the transverse waves where the reaction completes. {bibtexcitelist:AS} Detonation cell size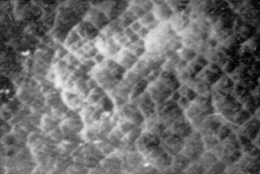 Figure 1. Detonation cells in tests In Figure 1 of the article Detonation front structure a diamond-shaped form demonstrates a typical track of triple points from intersecting shock waves. Such track is called detonation cell and can be easily obtained experimentally on sooted surfaces located in detonating gases. These cells form a cellular structure observed experimentally, and are characterized by their two lengths: longitudinal size L and transverse size S. These two lengths are varying depending on type of burnable gase and initial conditions, how-ever the relation S ≈ 0.6 L are kept usually constant. In Figure 1 an example of detonation cell in stoichiometric hydrogen-air mixture is shown. In the figure a soot track of irregular detonation cellular structure in stoichiometric H2-air mixture is shown (KuznetsovMS:2000), (KuznetsovM:2002c). Average transverse cell size of the test shown in the figure S ≈ 1 cm. The detonation cell size is kept constant for the given components for the same initial condition and depends only on the mixture composition, and therefore is often used as a mesure of mixture reactivity.  Figure 2. Detonations cell sizes Usually the detonation cell size reaches its minimum at the stoichiometry composition and grows for leaner and richer mixtures. In Figure 2 a dependence of the detonation cell size for H2-air mixtures on initial H2 concentration and mixture temperature ((CiccarelliG:1994) (KaneshigeM:1997) is shown. Kuznetsov M.S., Alekseev V.I. and Dorofeev S.B. (2000) Comparison of critical conditions for DDT in regular and irregular cellular detonation systems. Shock Waves, 10:217-224.(BibTeX) Detonation stabilityGaseous detonations propagating close to the Chapman-Jouguet (CJ) velocity all have unstable fronts, and there is a large body of work (Voitsekhovskii et al. 1966, Strehlow 1964, Oppenheim et al. 1968, Urtiew 1970, Edwards et al. 1972) documenting the common features of oscillations in the main shock strength, weak shocks moving transversely to the main front, and the quasi-periodic or cellular nature of the disturbances. These features are particularly prominent in mixtures with large amounts of monatomic gas dilution.  Figure 1. Images of detonation front propagating from left to right in 2H2-O2-12Ar, P1 = 20 kPa in the narrow channel. (A) Schlieren image. The box shows the location of the corresponding OH fluorescence image shown in (B). (C) Super-imposed schlieren and fluorescence images (the false color is a function of the intensity of the signal). PLIF image is 60 mm high. Traditionally, the degree of detonation front instability has been classified by the regularity of the cellular structure as determined from soot foils by visual inspection (Strehlow 1969) and image analyses (Shepherd et al. 1986). As an alternative, one can use the distance from the longitudinal neutral stability boundary in reduced activation energy versus Mach number coordinates as a figure of merit to quantify the degree of instability. For hydrogen mixtures the activation energy is the dominant parameter. In the context of a single-step irreversible reaction rate, detonation waves are stable if the activation energy Ea is less than a critical value, which depends on the ratio of specific heats \gamma , chemical energy content Q/RT1 of the mixture, and overdrive factor f =(U/UCJ)2. Eckett (2000) showed that the one-dimensional neutral stability curve for f = 1 is independent of \gamma if expressed in terms of the reduced activation energy \Theta = Ea/RTvN where TvN is the temperature at the von Neumann state and the CJ Mach number, MCJ. Weakly unstable detonations occur in mixtures with stability parameters (\Theta \approx 5, MCJ \approx 4.6). In particular, this category includes detonations in 2H2-O2 with more than about 50% Ar dilution; these mixtures are well known to have very regular soot foil patterns. An image of weakly unstable detonation is shown in Fig.1.  Figure 2. Images of detonation front propagating from left to right in 2H2-O2-3.5N2, P1 = 20 kPa in the narrow channel.(A) Schlieren image. The box shows the location of the corresponding OH fluorescence image shown in (B). (C) Superimposed schlieren and fluorescence images. PLIF image is 30 mm high. N2-diluted 2H2-O2 mixtures with \Theta \approx 7 may be classified as moderately unstable. These mixtures have soot foil patterns that are less regular than those of the weakly unstable mixtures. A sample image of a moderately unstable detonation front is shown in Fig. 2. The mixtures such as H2-N2O-1.33N2 or H2-N2O-1.77N2 with \Theta \approx 11 may be classified as highly unstable. Austin J.M., Pintgen F., Shepherd J.E. (2005) Proc.Comb.Inst. 30, pp.1849-1857 Steady and unsteady detonationsNon-uniform mixtures detonationsThe problem of detonation initiation through transmission of detonations from one explosive mixture to another connects the problem of blast initiation with the problem of spontaneous detonation. The phase of a detonation transmission to a less sensitive mixture plays an important role in the spontaneous initiation of a detonation (Kryuchkov, 1996; Kuznetsov, 1997). Reinitiation of detonation across inert or insensitive gaps and detonation transmission to less sensitive mixtures were studied by Bull (1981), Thomas (1991), Engebretsen (1991) and Teodorczyk (1995).These investigations showed that detonation reinitiation was enhanced by increase of detonation parameters in the donor mixture, decrease of the length of a gap and increase of the reactivity of the acceptor and gap mixtures. It was also found that the critical driver length for detonation transmission increases with decrease of acceptor mixture sensitivity. Ratios of the critical driver length Lc to characteristic chemical length scales, such as detonation cell width \lambda , critical tube diameter dc, and reaction zone width \delta , were found to be functions of effective intensity of initiating wave. The latter depends on both difference in the energy content of the mixtures and their reaction rates. Kryuchkov S.I., Dorofeev S.B., Efimenko A.A. (1996), Critical Conditions for Detonation Propagation Through Mixture with Decreasing Reaction Rate, Proceeding of the Combustion Institute, Vol.26, 2965-2972 Strategies in the prevention of detonation
<< | Content | >> |
|||||||||||||||||||||||||||||||||||||||||||||||||||||||||||||||||||||||||||||||||||||||||||||||||||||||||||||||||||||||||||||||