|
BRHS /
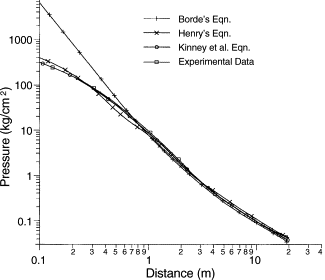
Modeling of Pressure WavesThe explosion energy in case of a BLEVE can be assessed by the difference between final and initial state of the bursting vessel assuming isentropic expansion. This plus a certain portion of the bursting pressure energy contribute to the blast wave generation (CSCHE:2004). The propagation of a pressure wave in a compressible medium can be described by the Rankine-Hugoniot equations (or “jump conditions”) based on the conservation equations for mass, momentum, and energy. From this relationship, it can be derived that the density ratio of air, if assumed to be an ideal gas, behind and in front of the shock front is limited to about 6. For air as a real gas, however, assuming to dissociate or ionize at high temperatures, this ratio can be significantly higher. A computer code, BLAST (Building Loads Analysis and Systems Thermodynamics), was developed based on the above equations as well as on empirical data from nuclear tests.  Fig. 1: Blast pressures vs. scaled distance for a detonation of 1 kg of TNT ([[http://hysafe.org/wiki/BRHS/Modeling?action=bibentry&bibfile=DB&bibref=PandeyAK:2006 | PandeyAK:2006)]] A first model description of the shock wave parameters for an explosion in air was given in 1870 by Rankine with shock front velocity, maximum dynamic pressure as functions of the peak static overpressure, speed of sound in air, and the atmospheric conditions. Later modelling efforts have used theoretical or empirical approaches to find agreement with experimental data (PandeyAK:2006). Fig. 1 shows a comparison of measured explosion pressures with different models. It was generally stated that agreement between theory and experiment is less good in the near-field compared to the medium and far-field because of the more complex flow pattern. Accurate empirical and theoretical models are existing for detonation waves. According to the Chapman-Jouguet (CJ) theory of 1899 and 1905, respectively, detonation represents a linear discontinuity, transforming the reactants completely to products at an infinite reaction rate. Detonation velocity and pressure can be calculated from equilibrium chemistry as a function of the gas mixture only. Respective data for hydrogen at NTP in an unsupported detonation are
The CJ theory predicts the thermodynamic state immediately behind the detonation wave, but cannot describe the structure of the wave. Processes inside the detonation front are extremely complex involving multi-dimensional shock interactions in an intensive turbulent reacting medium. Still, the simple one-dimensional CJ model prediction of velocity and overpressure is quite close to what is being observed, within a few per cent for velocity and 10-15 % difference for the pressure measurements (TieszenSR:1993). CJ (and AICC) pressures of a fixed gas mixture increase linearly with the initial pressure at constant initial temperature, and are inversely proportional to the initial temperature at constant initial pressure. However, the CJ theory is not capable of determining the dynamic detonation parameters such as detonability limits, initial energy or critical tube diameter. No theory exists so far that provides estimates of these parameters. CJ parameters of a gas or gas mixtures can be calculated with the code STANJAN developed at the Stanford University. In the ZND (Zel’dovich-von Neumann-Doering) theory, the detonation wave is described as a two-dimensional dome-shaped shock wave, where at its front both temperature and pressure rise. It is followed by a reaction zone whose thickness is determined by the reaction rate. Here the detonable substance reacts at high pressure and temperature until everything is transformed into product gases. The chemical reaction causes a rapid fall in pressure (“von Neumann spike”). The reaction zone remains unchanged (steady) when moving through the substance. A variable ranging between 0 and 1 describes the respective state and the progress of chemical reaction, respectively. Detonation velocities and pressures are less than for a plane shock front. A very simple way of modeling blast effects is the TNT Equivalent method derived from the decay of shock waves from high-explosive or nuclear explosions in the atmosphere. It is an estimation of the mass of TNT per unit mass of fuel, whose detonation would result in the same blast wave at the same distance. One kg of TNT translates into energy of 4520 kg meaning that 1 Nm3 of hydrogen gas corresponds to 2.22 kg of TNT. The weakness of the TNT Equivalent model, if applied to a vapor cloud explosion, is to ignore the pressure-time characteristic differences between a gas cloud and a detonative TNT explosion. It is deemed to overestimate near-field and underestimate far-field effects. Furthermore the model does not consider the influence of turbulence and confinement. The TNT model considers only the total amount of fuel involved and particularly does not take into account the yield factor in a vapor cloud explosion, which is generally only a small fraction, in most cases < 1 %. The most common form of blast scaling law is that according to Hopkinson and Cranz (BakerWE:1983):
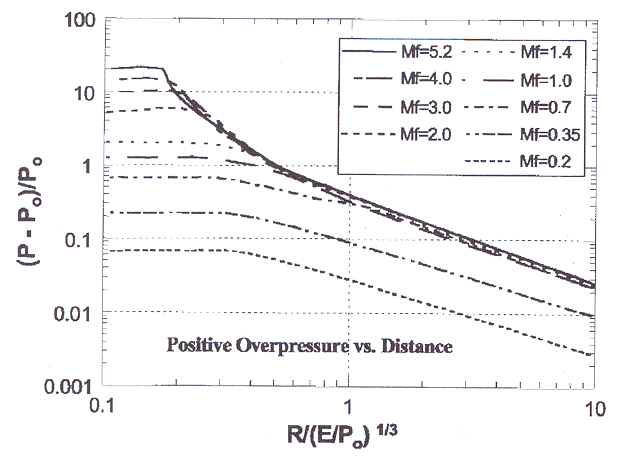
where Z is the scaled distance, R is the distance from the center of explosion, E is the total heat of combustion, W is the total weight of a standard explosive (such as TNT). The law has been validated against numerous experiments over a large range of explosion energies and can be applied to predict blast wave properties of large-scale explosions based on the data of smale-scale experiments (assuming same explosive, same geometry). There is, however, a lack of experimental data at very small scaled distances; the above relation appears to become inappropriate for Z < 0.16 m/kg1/3.  Fig. 2: Baker-Strehlow-Tang curves of overpressure vs. distance for various flame Mach numbers ([[http://hysafe.org/wiki/BRHS/Modeling?action=bibentry&bibfile=DB&bibref=TangMJ:1999 | TangMJ:1999)]] A wide variety of explosion experiments has been evaluated to derive blast charts. Commonly known and accepted are the Baker-Strehlow blast curves for vapor cloud explosions in the open atmosphere or the TNO blast waves for hemispherical explosions. It is a good engineering tool finding its limits when real gas clouds rather than idealized are considered. An improvement towards a more realistic modeling was made with a new set of blast curves, called the Baker-Strehlow-Tang curves (Fig. 2), by considering a more precise blast pressure decay behavior. The result is a considerable reduction at long distances. The curves were validated in all combustion regimes (TangMJ:1999). Models for BLEVE Blast prediction are also described in the CCPS guidelines (AICHECCPS:1994) and the so-called ‘Yellow Book’ of TNO (CPR14E:2005:YellowBook). These references also describe models to predict the magnitude and duration of the fireball which often follows a BLEVE. Recently a new numerical method to calculate the blast effects originating from an exploding vessel of liquefied gas have been derived (vandenBergAC:2004)(vandenBergAC:2004). Adequate blast calculation requires full knowledge of the blast source characteristics, i.e., the release and subsequent vaporization rate of the flashing liquid. As the conditions that allow explosive vaporization are not entirely clear and the vaporization rate of a flashing liquid is unknown, safe assumptions have been adopted as the starting point in the modelling. The blast effects from a BLEVE are numerically computed by imposing the vapour pressure of a flashing liquid as boundary condition for the gas dynamics of expansion. The modelling shows that the rupture of a pressure vessel containing a liquefied gas in free space only develops a blast of significant strength if the vessel near-instantaneously disintegrates.  Fig. 3: Blast overpressure vs. scaled distance for different explosion strengths according to the Multi-Energy method ([[http://hysafe.org/wiki/BRHS/Modeling?action=bibentry&bibfile=DB&bibref=MercxWPM:2000 | MercxWPM:2000)]] The TNO Multi-Energy method is based on the Multi-Energy concept, which consists in the feature of gas deflagration that overpressure and blast develop only under appropriate boundary conditions, i.e., only where the flammable mixture is partially confined and/or obstructed (AICHECCPS:1994)(MercxWPM:1991)(MercxWPM:2000). This assumption can be made provided that transition to detonation to DDT does not take place. For hydrogen, this requirement is not as easily fulfilled as it is for most hydrocarbons. Based on the Multi-Energy concept, a vapor cloud explosion is modeled as series of hemispherical model charges. Each model charge is characterized by a charge size and a charge strength. The charge size is related to the heat of combustion present in the source, while the charge strength is related to the explosion overpressure. Based on these characterizations, scaled blast parameters (peak overpressure, positive phase duration) as a function of scaled distance have been calculated with the TNO FCT ("Flux-Corrected Transport") Euler solver ‘BLAST’ (Fig. 3) (MercxWPM:2000). The strength of the blast wave is expressed as a number between 1 and 10 representing categories of “insignificant” to “detonative”. Calculation results suggest that damaging explosions can occur only, when flame acceleration takes place within a plant structure (MercxWPM:1991)(MercxWPM:2000). The charge strength can be determined either by numerical calculation (CFD) or by using the experimentally based GAME correlation Invalid BibTex Entry!, a relation between the overpressure and details of obstacle configurations. The charge size is influenced by the Critical Separation Distance (CSD), the distance between two obstructed regions above which a vapor cloud explosion can be modeled as two separate sources of blast. Guidance on the CSD has been obtained in experimental research projects such as RIGOS Invalid BibTex Entry!. It has been found that the CSD between a ‘donor’ and an ‘acceptor’ increases with the explosion overpressure up to a maximum of half the donor dimension. The Research Center Karlsruhe has developed the calculation models DET1D and DET3D to determine the characteristic detonation parameters within the reaction zone and outside in the unburnt mixture. These models have been mainly applied to assess the load on a nuclear containment upon confined combustion of homogeneous mixtures of H2, O2, N2, H2O. Code validation was made against the Russian RUT experiments and FH-ICT balloon tests (see Figs. 1 and 2 in previous section on "Experimental Work"). Parameter calculations of a 3D detonation have shown that the 3D structure is not important for the pressure load and that a relatively coarse grid provides sufficient accuracy (BreitungW:1995). The state-of-the-art approach to modeling of combustion phenomena are 3D CFD codes, which need to be adapted to the spatial and temporal lengths characteristic for chemical reactions. Typical time steps for hydrodynamic flow calculations are in the order of 10-6 s and for the H2-O2 reaction mechanism 10-10 s (BreitungW:1995). Many approaches are based on the assumption of incompressible flows and are restricted to slow deflagrations or to pure detonations. For fast deflagrations with Mach numbers > 0.3, incompressibility can no longer be assumed, since pressure waves are not negligible. Several methods of turbulence modelling have been developed. In the “Reynolds Averaged Navier Stokes” (RANS) equations, turbulence is modelled by means of a turbulence viscosity which can be calculated in a k-ε two-equations system. In contrast, the “Direct Numerical Simulation” (DNS) employs the direct and complete solution of the conservation equations taking into consideration all turbulent structures. Somewhere in between is the method “Large Eddy Simulation” (LES) where only the large turbulence structures are being dissolved by the calculation grid, whereas small turbulences are filtered away and covered a turbulence viscosity model approach. Today’s modeling and simulation show good agreement with a variety of fast combustion phenomena. It has the potential to provide accurate data for realistic scenarios depending on how accurately the respective submodels are working. For example, the above mentioned LES method for turbulent flows with high Reynolds numbers was successfully applied to the FH-ICT deflagration test with stoichiometric H2-air mixture (MolkovVV:2005a). The application of computer models, however, should be limited to cases or ranges, for which the codes were validated. Examples of CFD codes applied to combustion are AIXCO (RWTH, Germany), AUTOREAGAS (TNO & ANSYS Century Dynamics, The Netherlands), CFX (Harwell, UK), FLACS (CMI, Norway), FLUENT (Fluent, USA), GASFLOW (FZK, Germany), PHOENICS (CHAM, UK). Invalid BibTex Entry! << Experimental Work | Content | Throw of Debris and Missiles >> |