|
BRHS /
Throw of Debris and MissilesNo fully validated model exists in terms of predicting projectile hazards from bursting pressure vessels. However, this difficult physical problem may be divided in two parts:
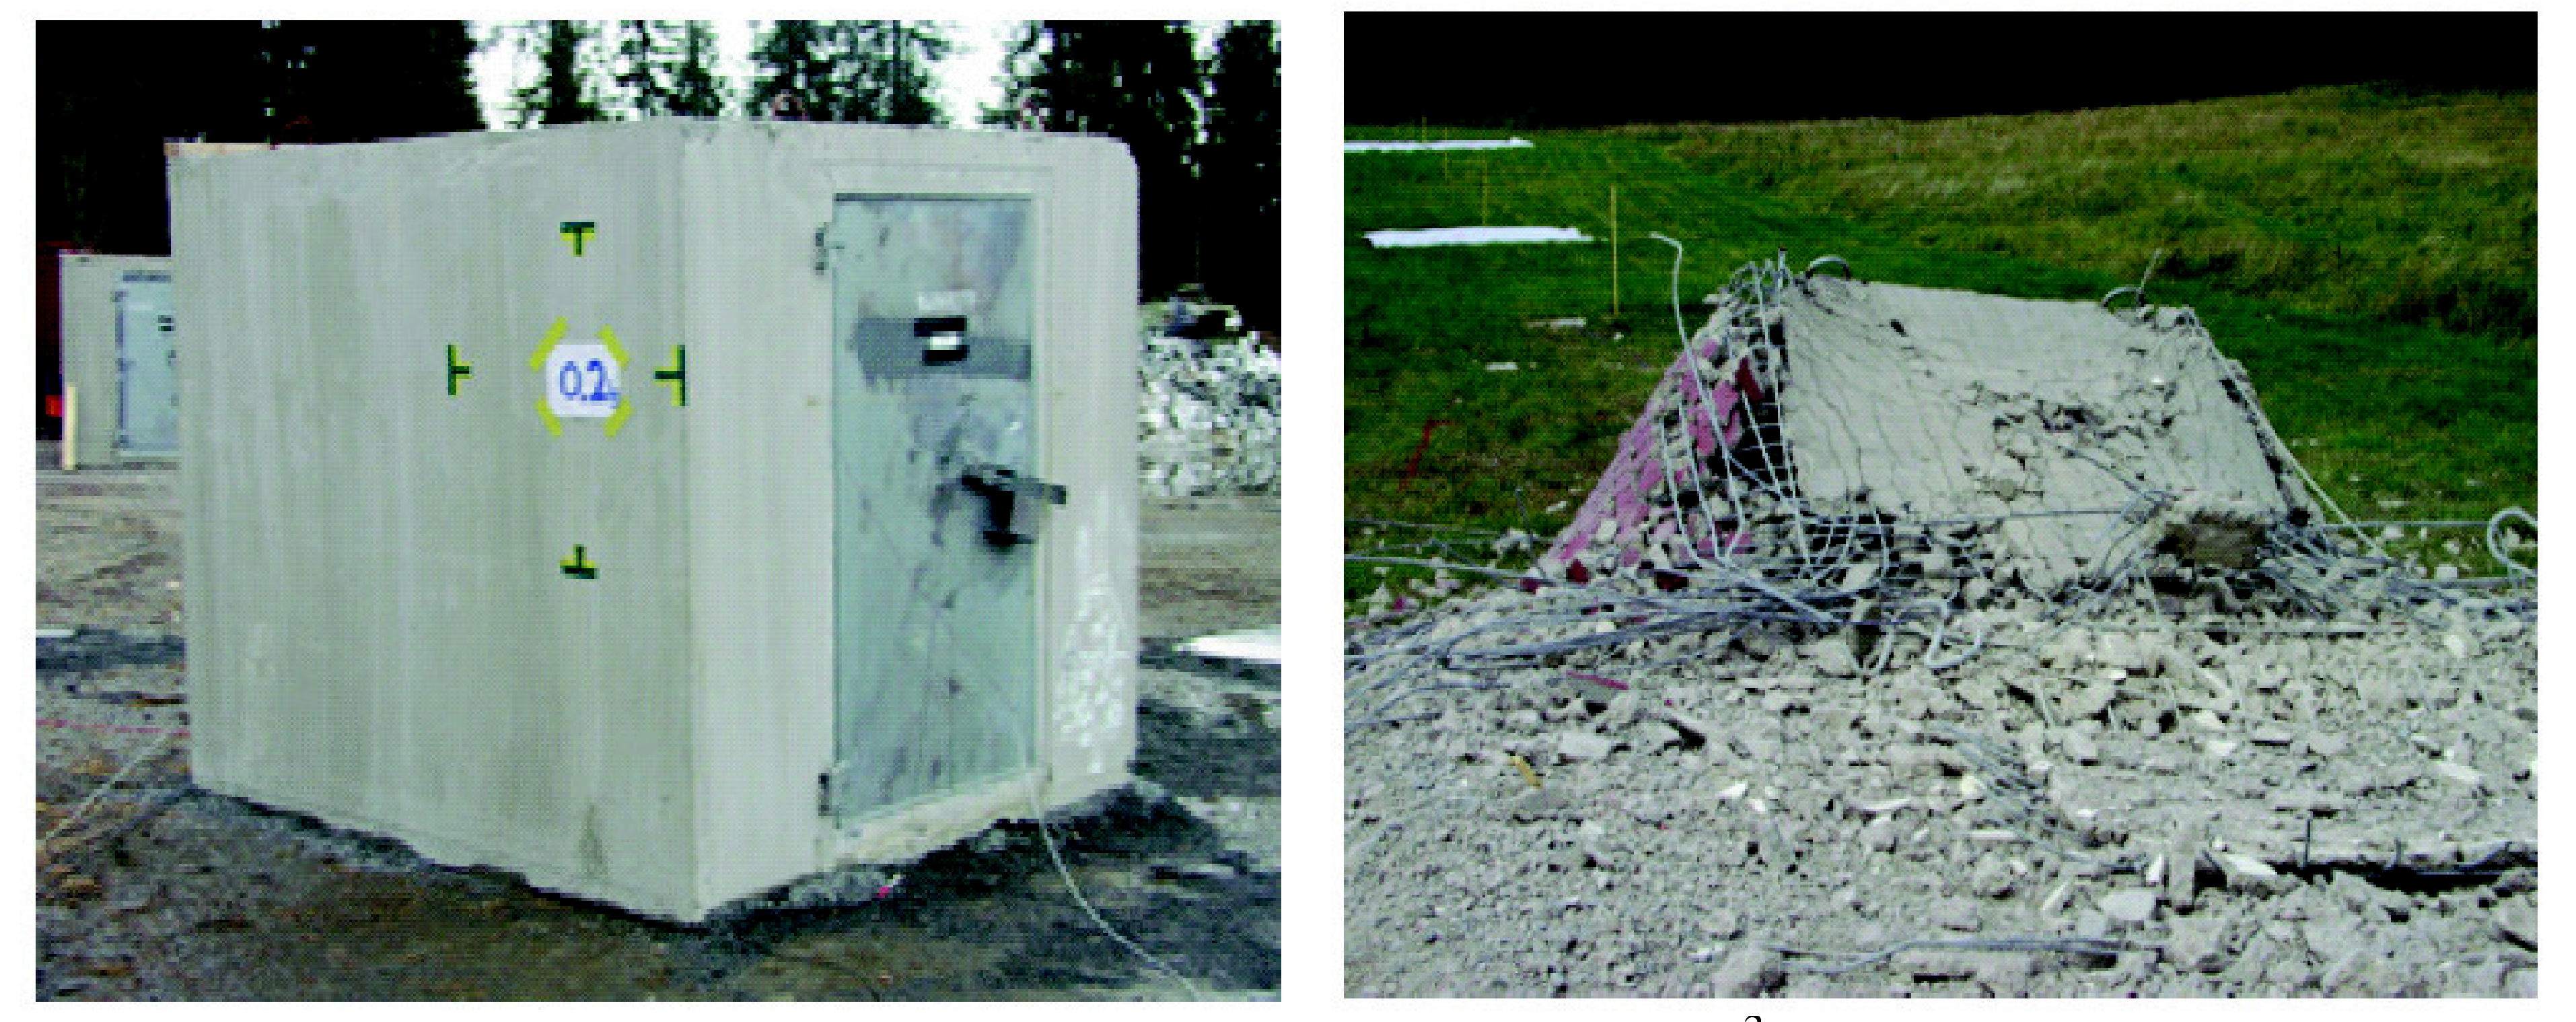
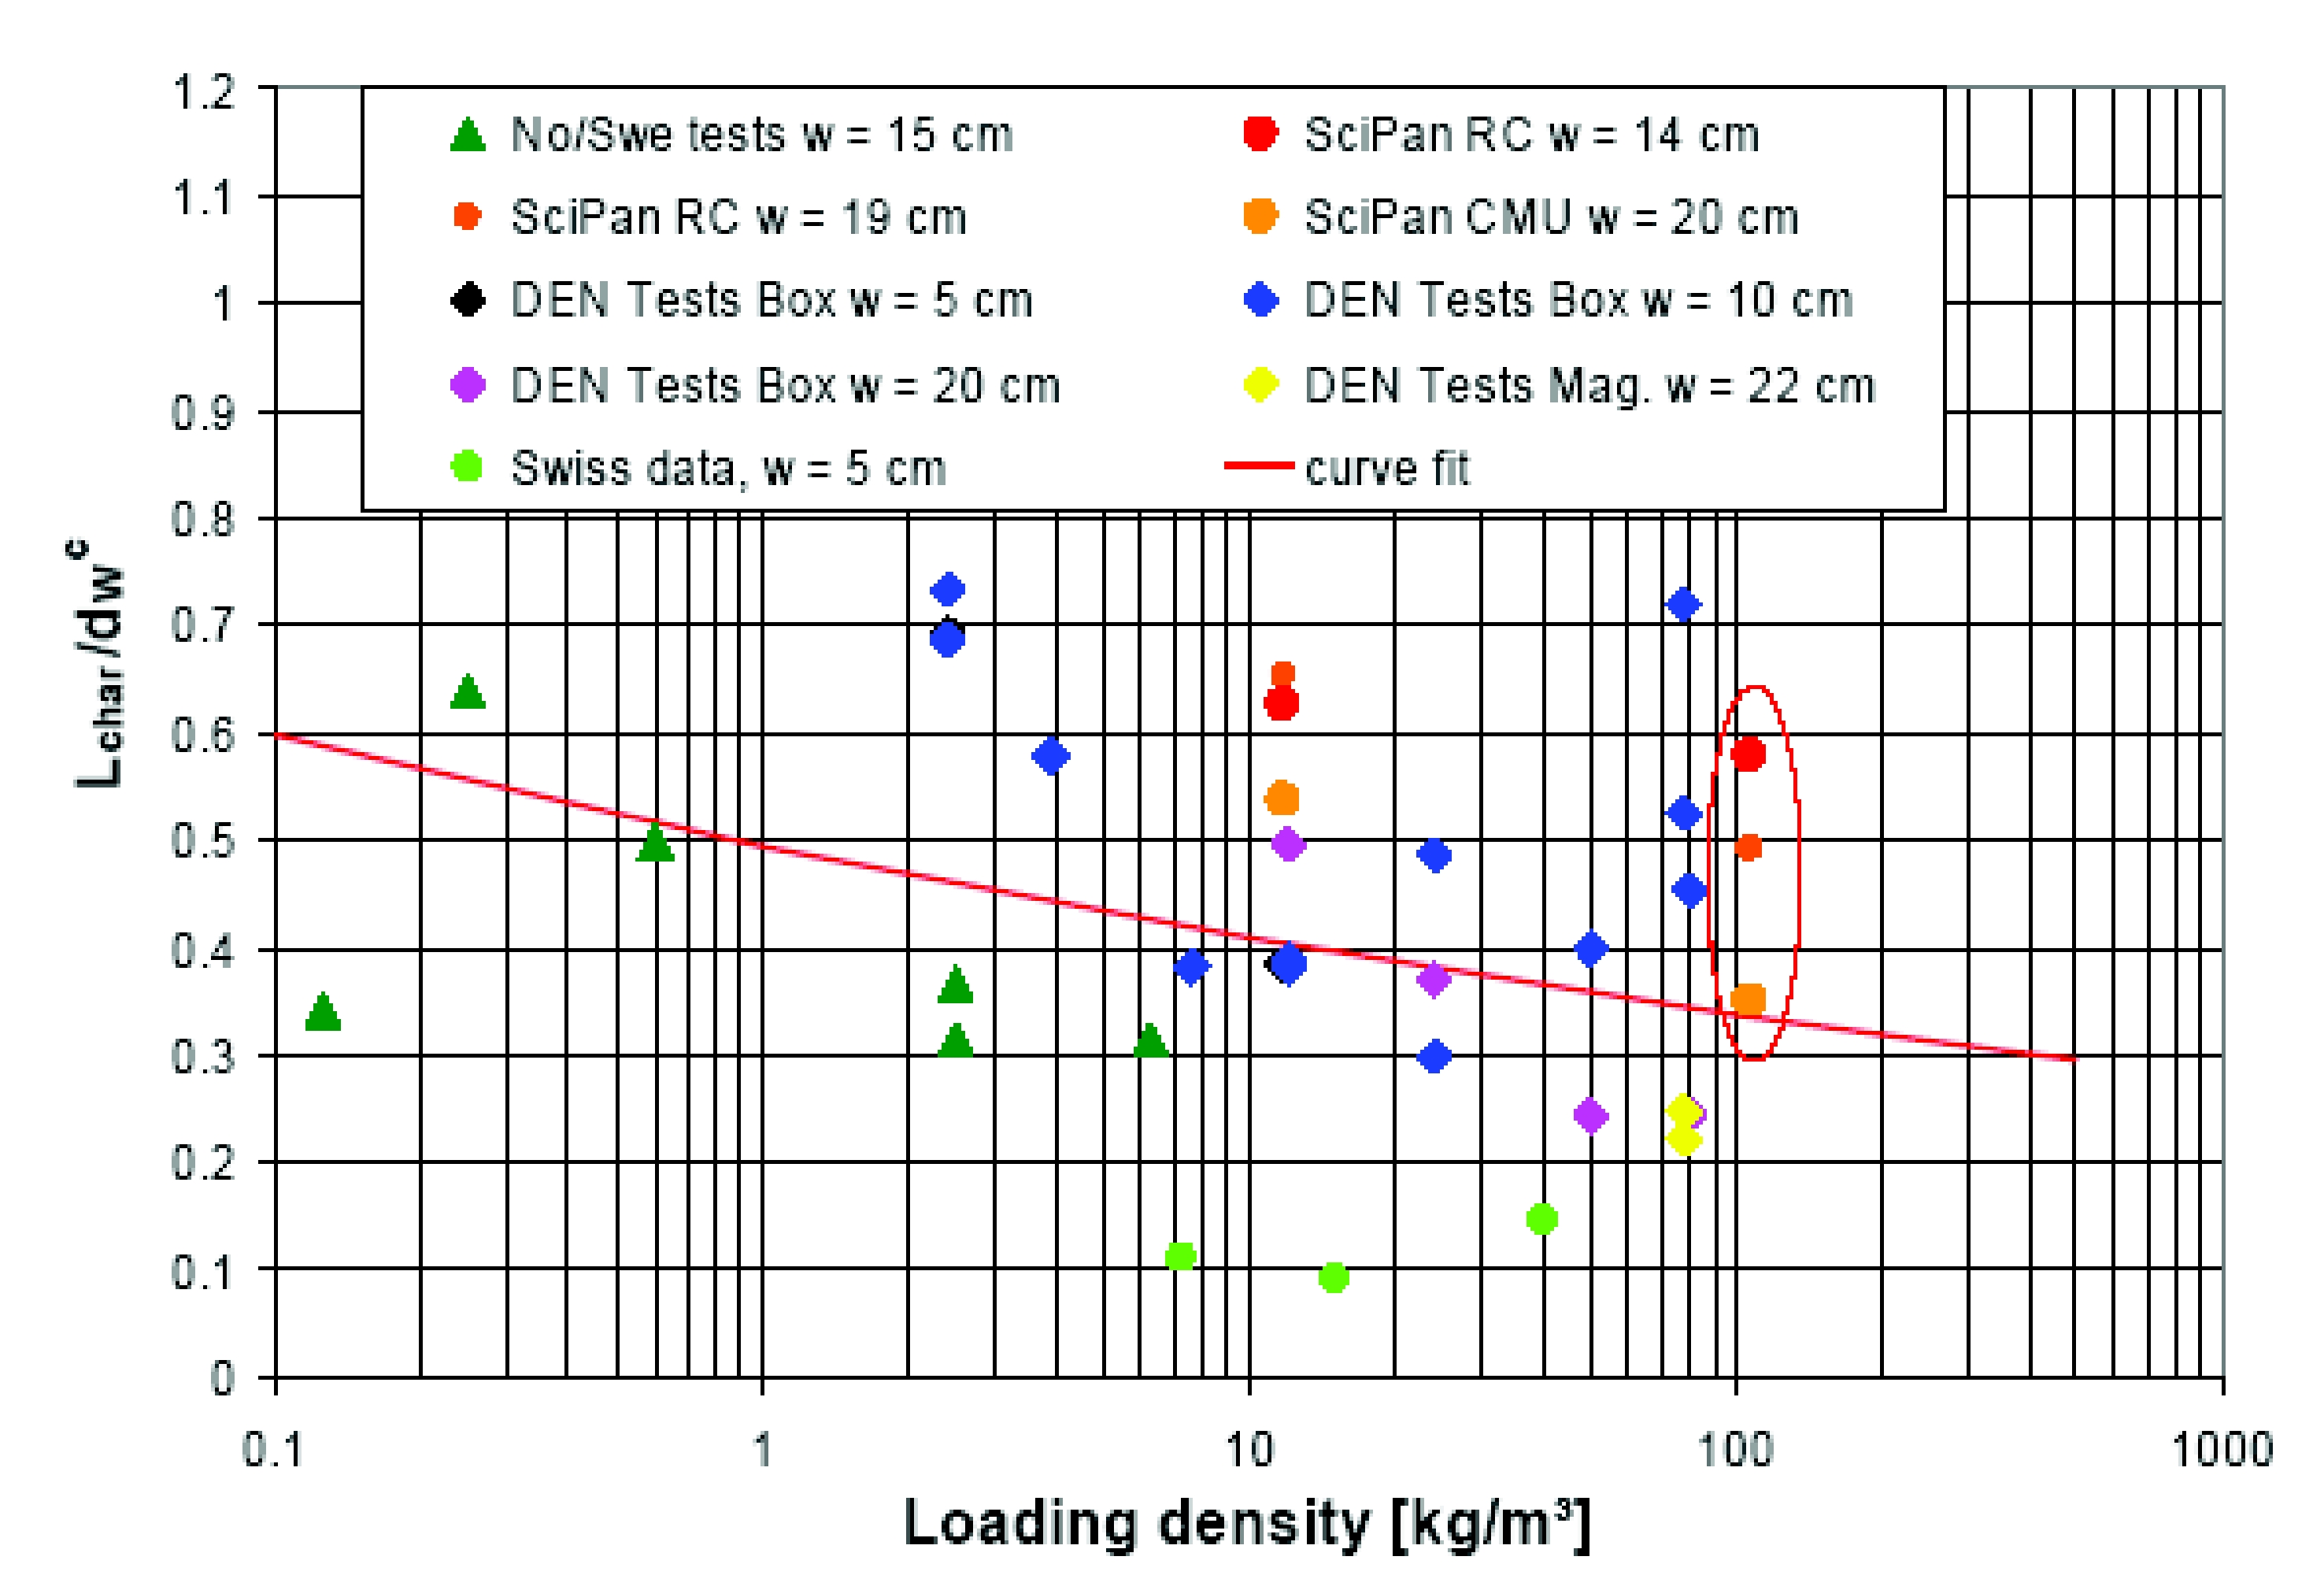
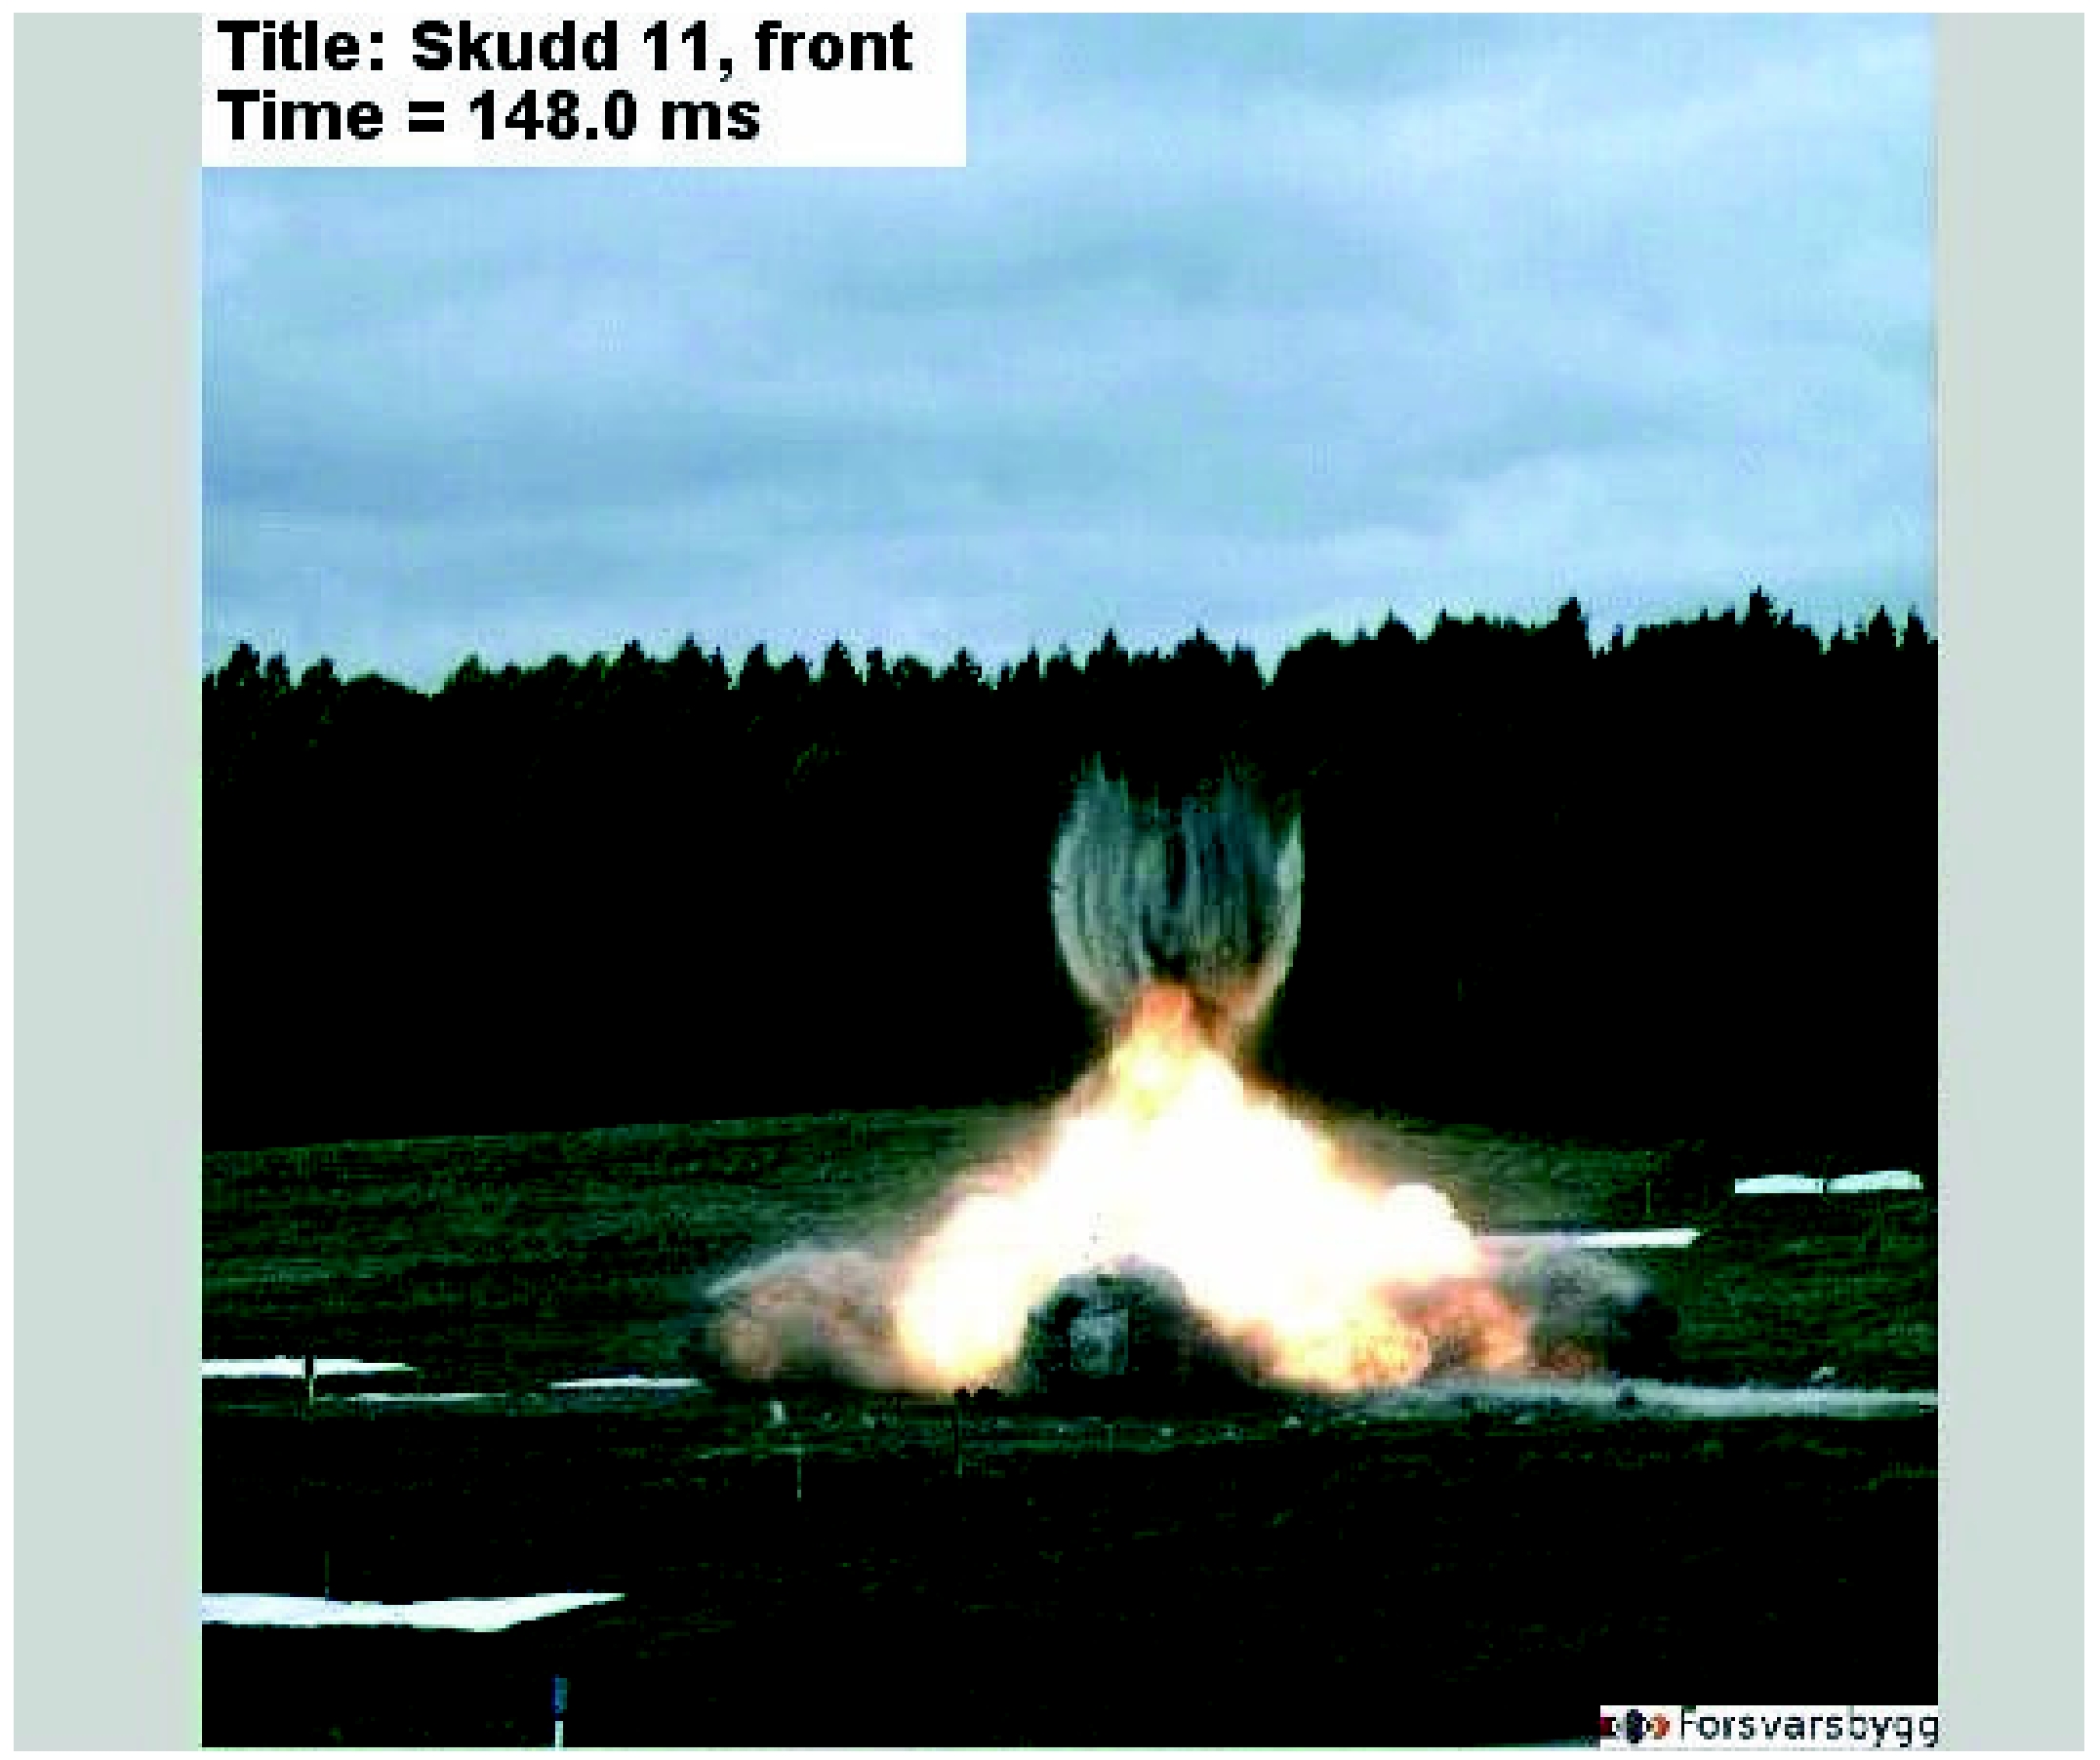
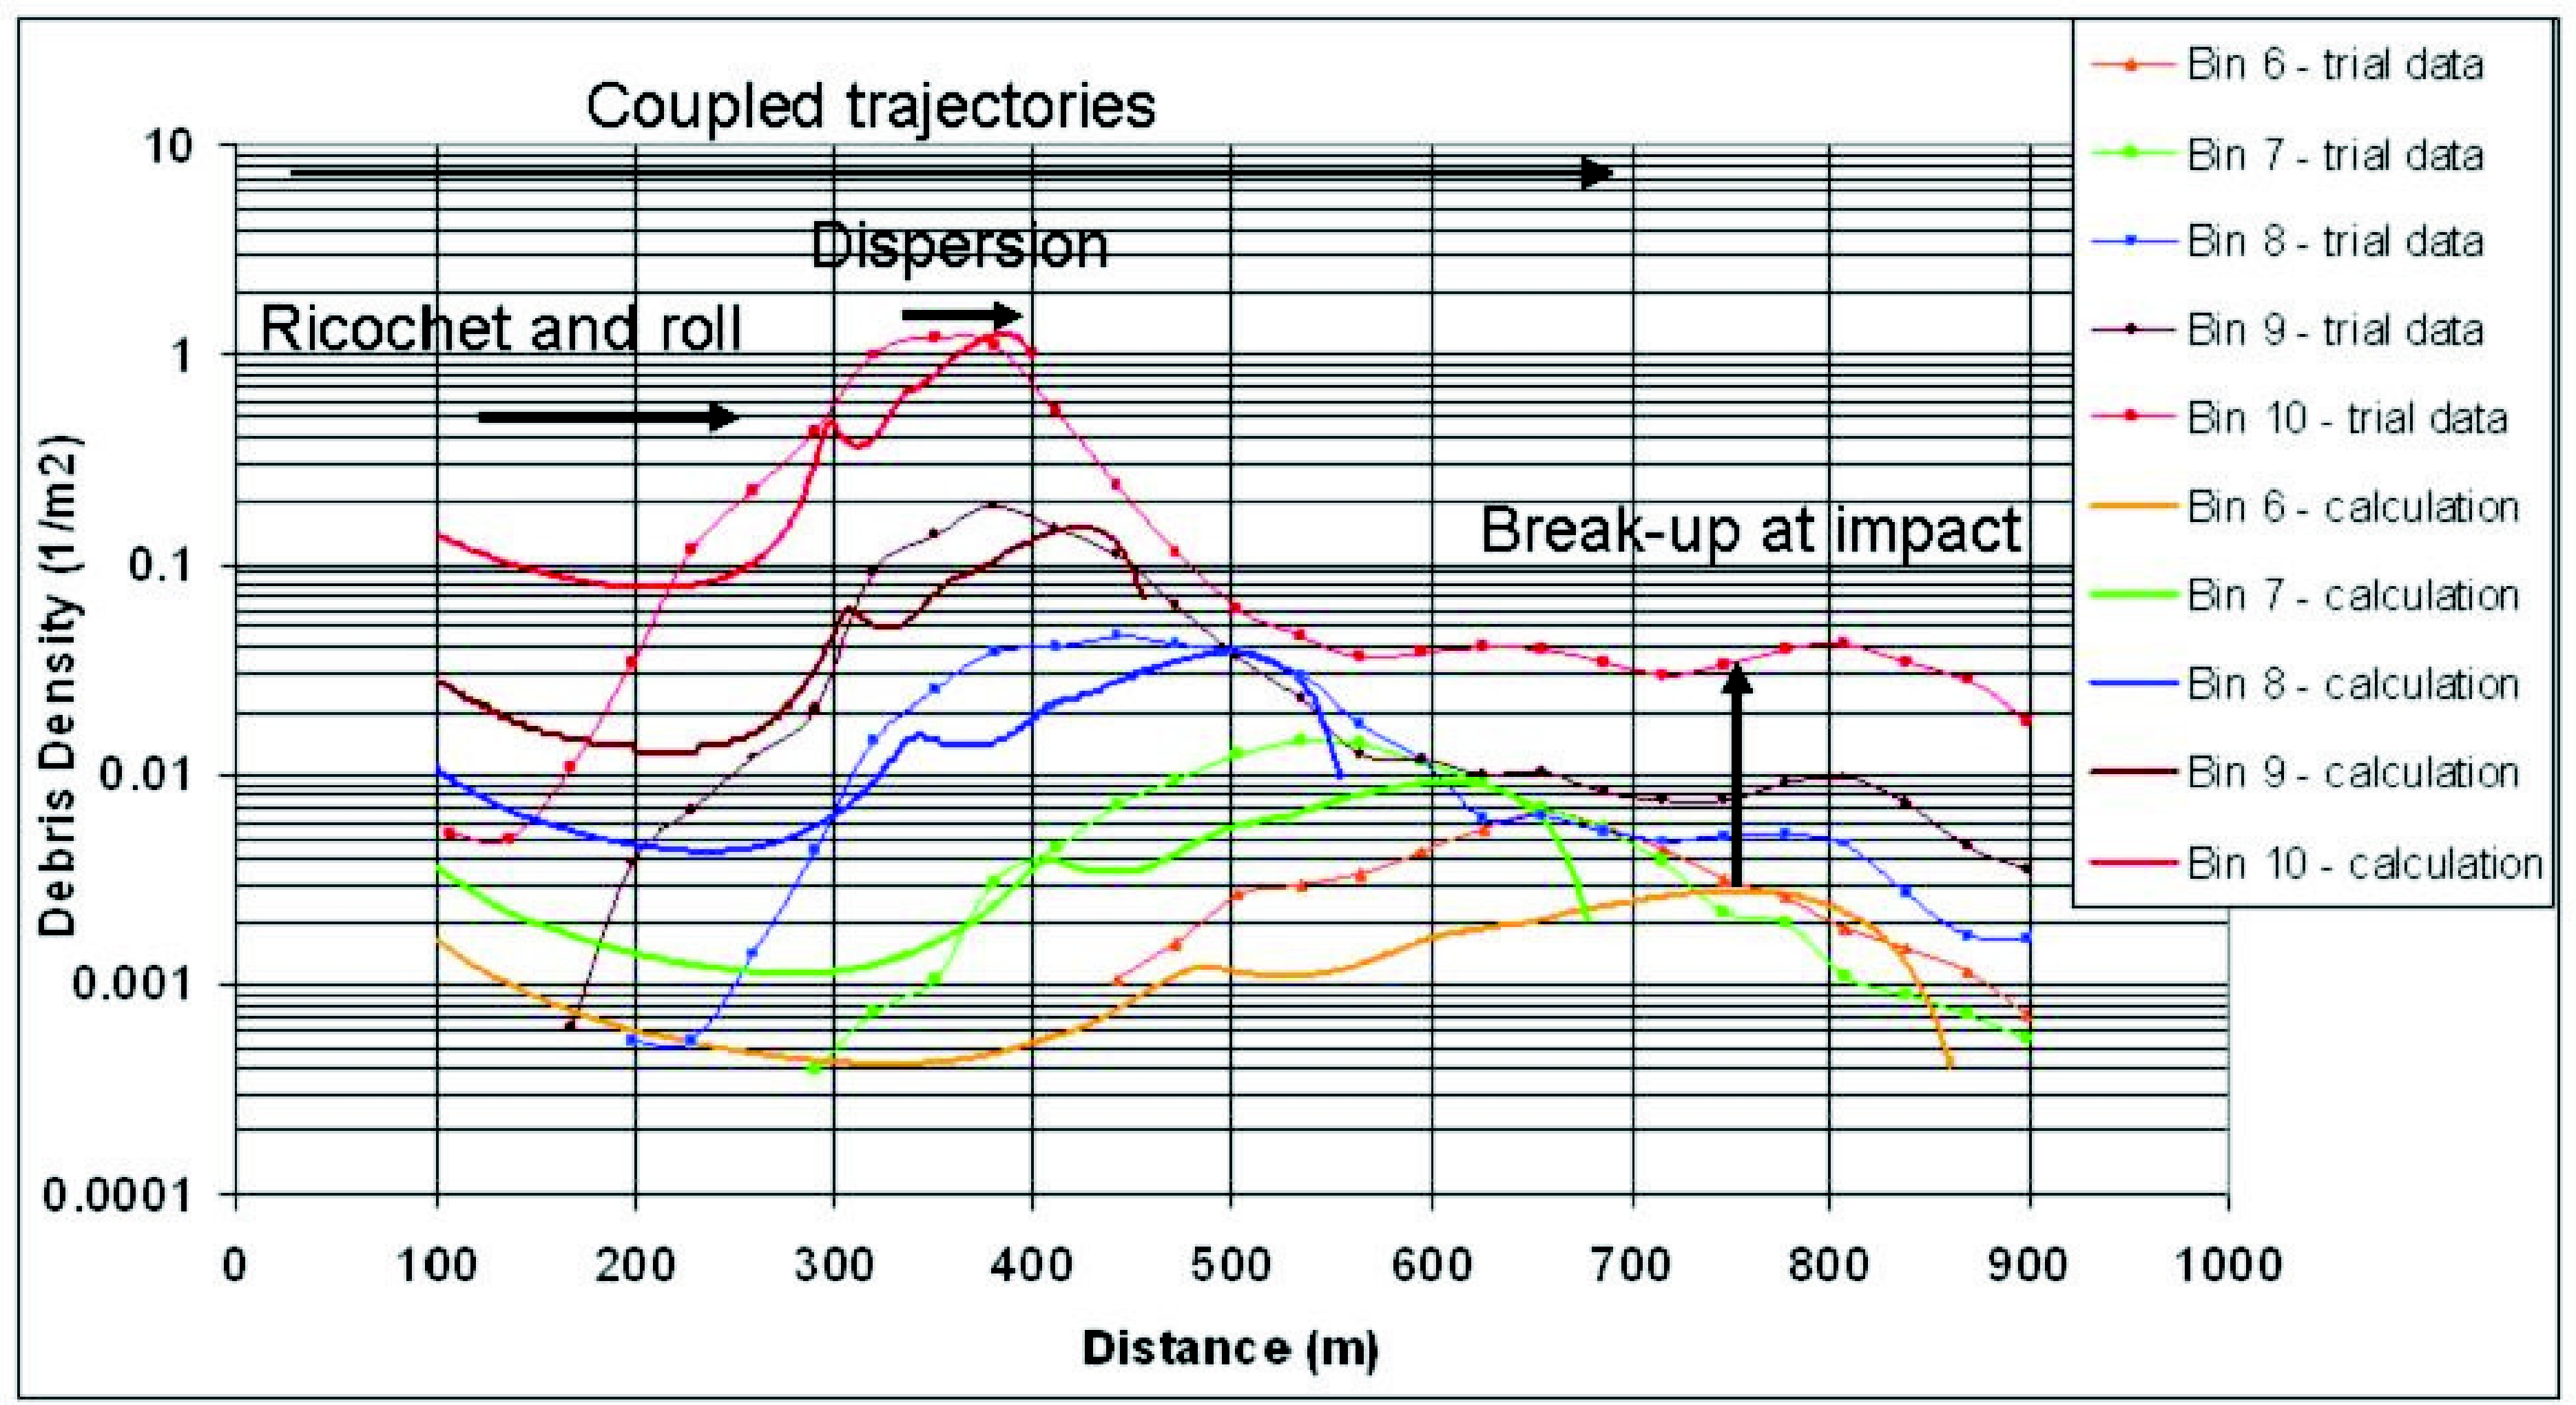
The first part is probably the most complex one, and only numerical simulation seems to allow for prediction using appropriate material and fracture models as, e.g., shown in (GursonAL:1977); (ErdoganF:1977); (MottNF:1943). The second part couples beginning solicitation and ballistic considerations. Solutions as suggested in (BaumMR:1999); (BakerWE:1983); (UFIP:2002) are the most widely applied and easy-to-handle models. The software PROJEX using a method developed by INERIS may also be used and seems to give better results (INERIS:2004). A global model based on statistical considerations is also being conceived in (HauptmannsU:2001). Most modeling approaches deal with the effects of blast and fire. In many hydrogen explosion scenarios however, the throw of missiles or debris is also important and in some cases even dominant. For hydrogen gas explosions this is typically the case for scenarios where some degree of confinement or enclosure is present. When in combination the combustion process changes from a deflagration to a detonation the throw of missiles or debris can be devastating. Examples are gas explosions inside industrial equipment, inside a garage or car park, or in a nuclear plant. These scenarios may lead to a major hazard of debris or missiles. Other types of explosions involving hydrogen are BLEVE�s and physical explosions. In these scenarios, it is typically a vessel rupture leading to the throw of missiles. Any risk assessment methodology for hydrogen should contain models for the throw of debris or missiles. The Initial ConditionsIn general the initial conditions for throw are defined by the distributions of the missile or debris mass, launch velocity, and launch direction. These conditions are determined by the failure process and the subsequent acceleration by the expanding gasses, or reaction products. This is accompanied by pressure relief as a result of the increasing vent area between the accelerating items. The initial conditions for throw of missiles from vessels, as a result of physical explosions, BLEVE�s and internal gas explosions can be determined with PGS02 (CPR14E:2005:YellowBook), referred to as the �Yellow Book�, and the CCPS Guideline (AICHECCPS:1994). In these references, the models of Baum (BLEVE�s), Baker (physical explosions) and Gel�fand (physical explosions and internal gas explosions) are presented. For BLEVE�s, the model of Baum predicts the initial velocity of missiles based on the amount of liberated energy. The model of Baker for physical explosions relates the initial velocity of missiles to a scaled overpressure, the vessel geometry, and the number of fragments. With the model of Gel�fand for internal gas explosions, the initial velocity is based on the scaled overpressure and a scaled energy release rate. The break-up process of buildings constructed from reinforced concrete or brick during an internal gas explosion is a more complicated phenomenon. In the case of a (weak) deflagration, the combustion continues during the break-up process and debris launch. The coupling between pressure build-up, venting, and break-up determines the part of the structure that will participate in the throw, and the distributions of debris launch velocity and launch direction. When a hydrogen detonation takes place inside a building the combustion process is completed before the structure starts to break up. As a result, the structure is loaded with a quasi-static load of typically 0.8 MPa overpressure. This by far exceeds the structural strength of any typical industrial building. As a result, the structure will largely break up and accelerate. Hydrogen detonations in buildings can be compared with bare quantities of high explosives in ammunition magazines. A similar quasi-static load is obtained when a bare charge resulting in a loading density of 0.25 kg/m3 of TNT is detonated. In Fig. 1, the result after the detonation of 2 kg of TNT in an 8 m3 Kasun-building (Norwegian "small quantities" ammunition storage building) is displayed (LangbergH:2004). For detonations of bare explosives in ammunition magazines, relations for the distributions of debris mass, launch velocity, and launch direction have been derived within the Klotz Group ((VanDoormaalJCAM:2006); (VanDoormaalJCAM:2006a)). Those relations are based on debris pick-up data from a collection of large scale trials, and depend on loading density and wall thickness. The cumulative debris mass distribution was found to decay exponentially with debris mass. The characteristic length of debris decreases slowly with loading density. Fig. 2 shows this characteristic length for a large collection of trial data. Note that the effective loading density for hydrogen detonations of 0.25 kg/m3 is situated at the low loading density regime of the trial database. The initial debris velocity decreases with debris mass around a typical velocity, the Debris Launch Velocity (DLV). This relation has been based on backward calculations. The launch angle distribution was found to be a rather sharp Gaussian distribution centered around a direction close to the wall normal directions. This directionality is illustrated in Fig. 3, where a frame is shown during the debris launch from a Kasun-building after detonation of 50 kg TNT. Note that this loading density exceeds the energy content of a hydrogen detonation by far. The addition of the new Sci Pan 3 trial to the database was recently reported (vanderVoortMM:2006). The relations are currently being implemented in a software code, the KG-Engineering Tool. The Throw of Debris and MissilesThe initial distributions are the required input for throw models. Throw models determine a collection of impact locations in the field. Together with the impact velocity and impact angle the consequences for the infrastructure and for human beings can be determined. Most existing throw models make use of a Monte Carlo technique. Predefined initial distributions of debris or missile mass, launch velocity and launch direction are sampled to obtain the initial conditions for a number of trajectory calculations. To obtain a proper representation of the debris or missile density in the field, the required number of Monte Carlo simulations needs to be very large. A global model based on statistical considerations is also being conceived in (HauptmannsU:2001). Recently TNO has developed a universal throw model (Van der Voort et al. 2006). The basis is the source function theorem, an underlying mathematical relation between the debris or missile density and the initial distributions. This model reduces the required number of trajectory calculations dramatically. Trajectory calculations have to be carried out with caution since the selected shape, orientation and drag coefficient of debris and missiles have a significant influence on throw distances. In Fig. 4 an application to the Sci Pan 3 trial is shown together with experimental results (vanderVoortMM:2006). Compared to hydrogen detonations, this trial is situated at the other end of the loading density regime (> 100 kg/m3), but illustrates the validity of the model in general. The calculations are in reasonable agreement with the experimental data. Differences can be recognized and understood as the model does not take into account:
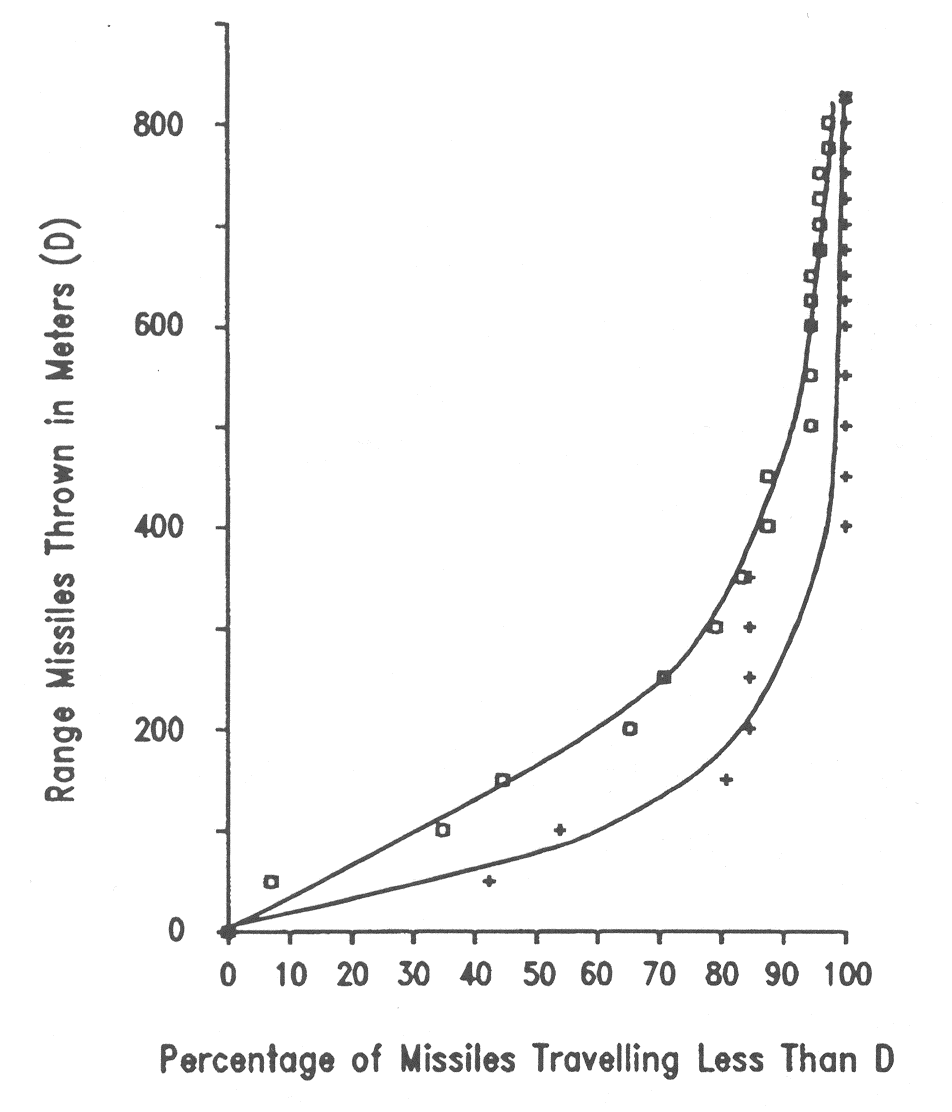
In reality, these phenomena play a role, but are, on the other hand, not always important in the field of risk assessment. Solutions as suggested in (BaumMR:1999); (BakerWE:1983); (UFIP:2002) are widely applied and easy-to-handle models. The software PROJEX using a method developed by INERIS may also be used and seems to give better results (INERIS:2004). Experimental data for the projectile hazards from bursting pressure vessels is displayed in Fig. 3-12. Data available are either from actual plant accidents on a large scale or from small-scale testing. The analysis shows among other findings that 80 % of all vessel ruptures resulting from fires lead to missiles, that non-fire ruptures have an increased number of fragments, that spherical vessels produce more fragments than cylindrical vessels, or that the end tubs of vessels travel further than other types of fragments. There is also the observed tendency of missiles to export fire (LeslieIRM:1991). Invalid BibTex Entry! << Modeling of Pressure Waves | Content | Interaction of Blast Wave with Structure >> |